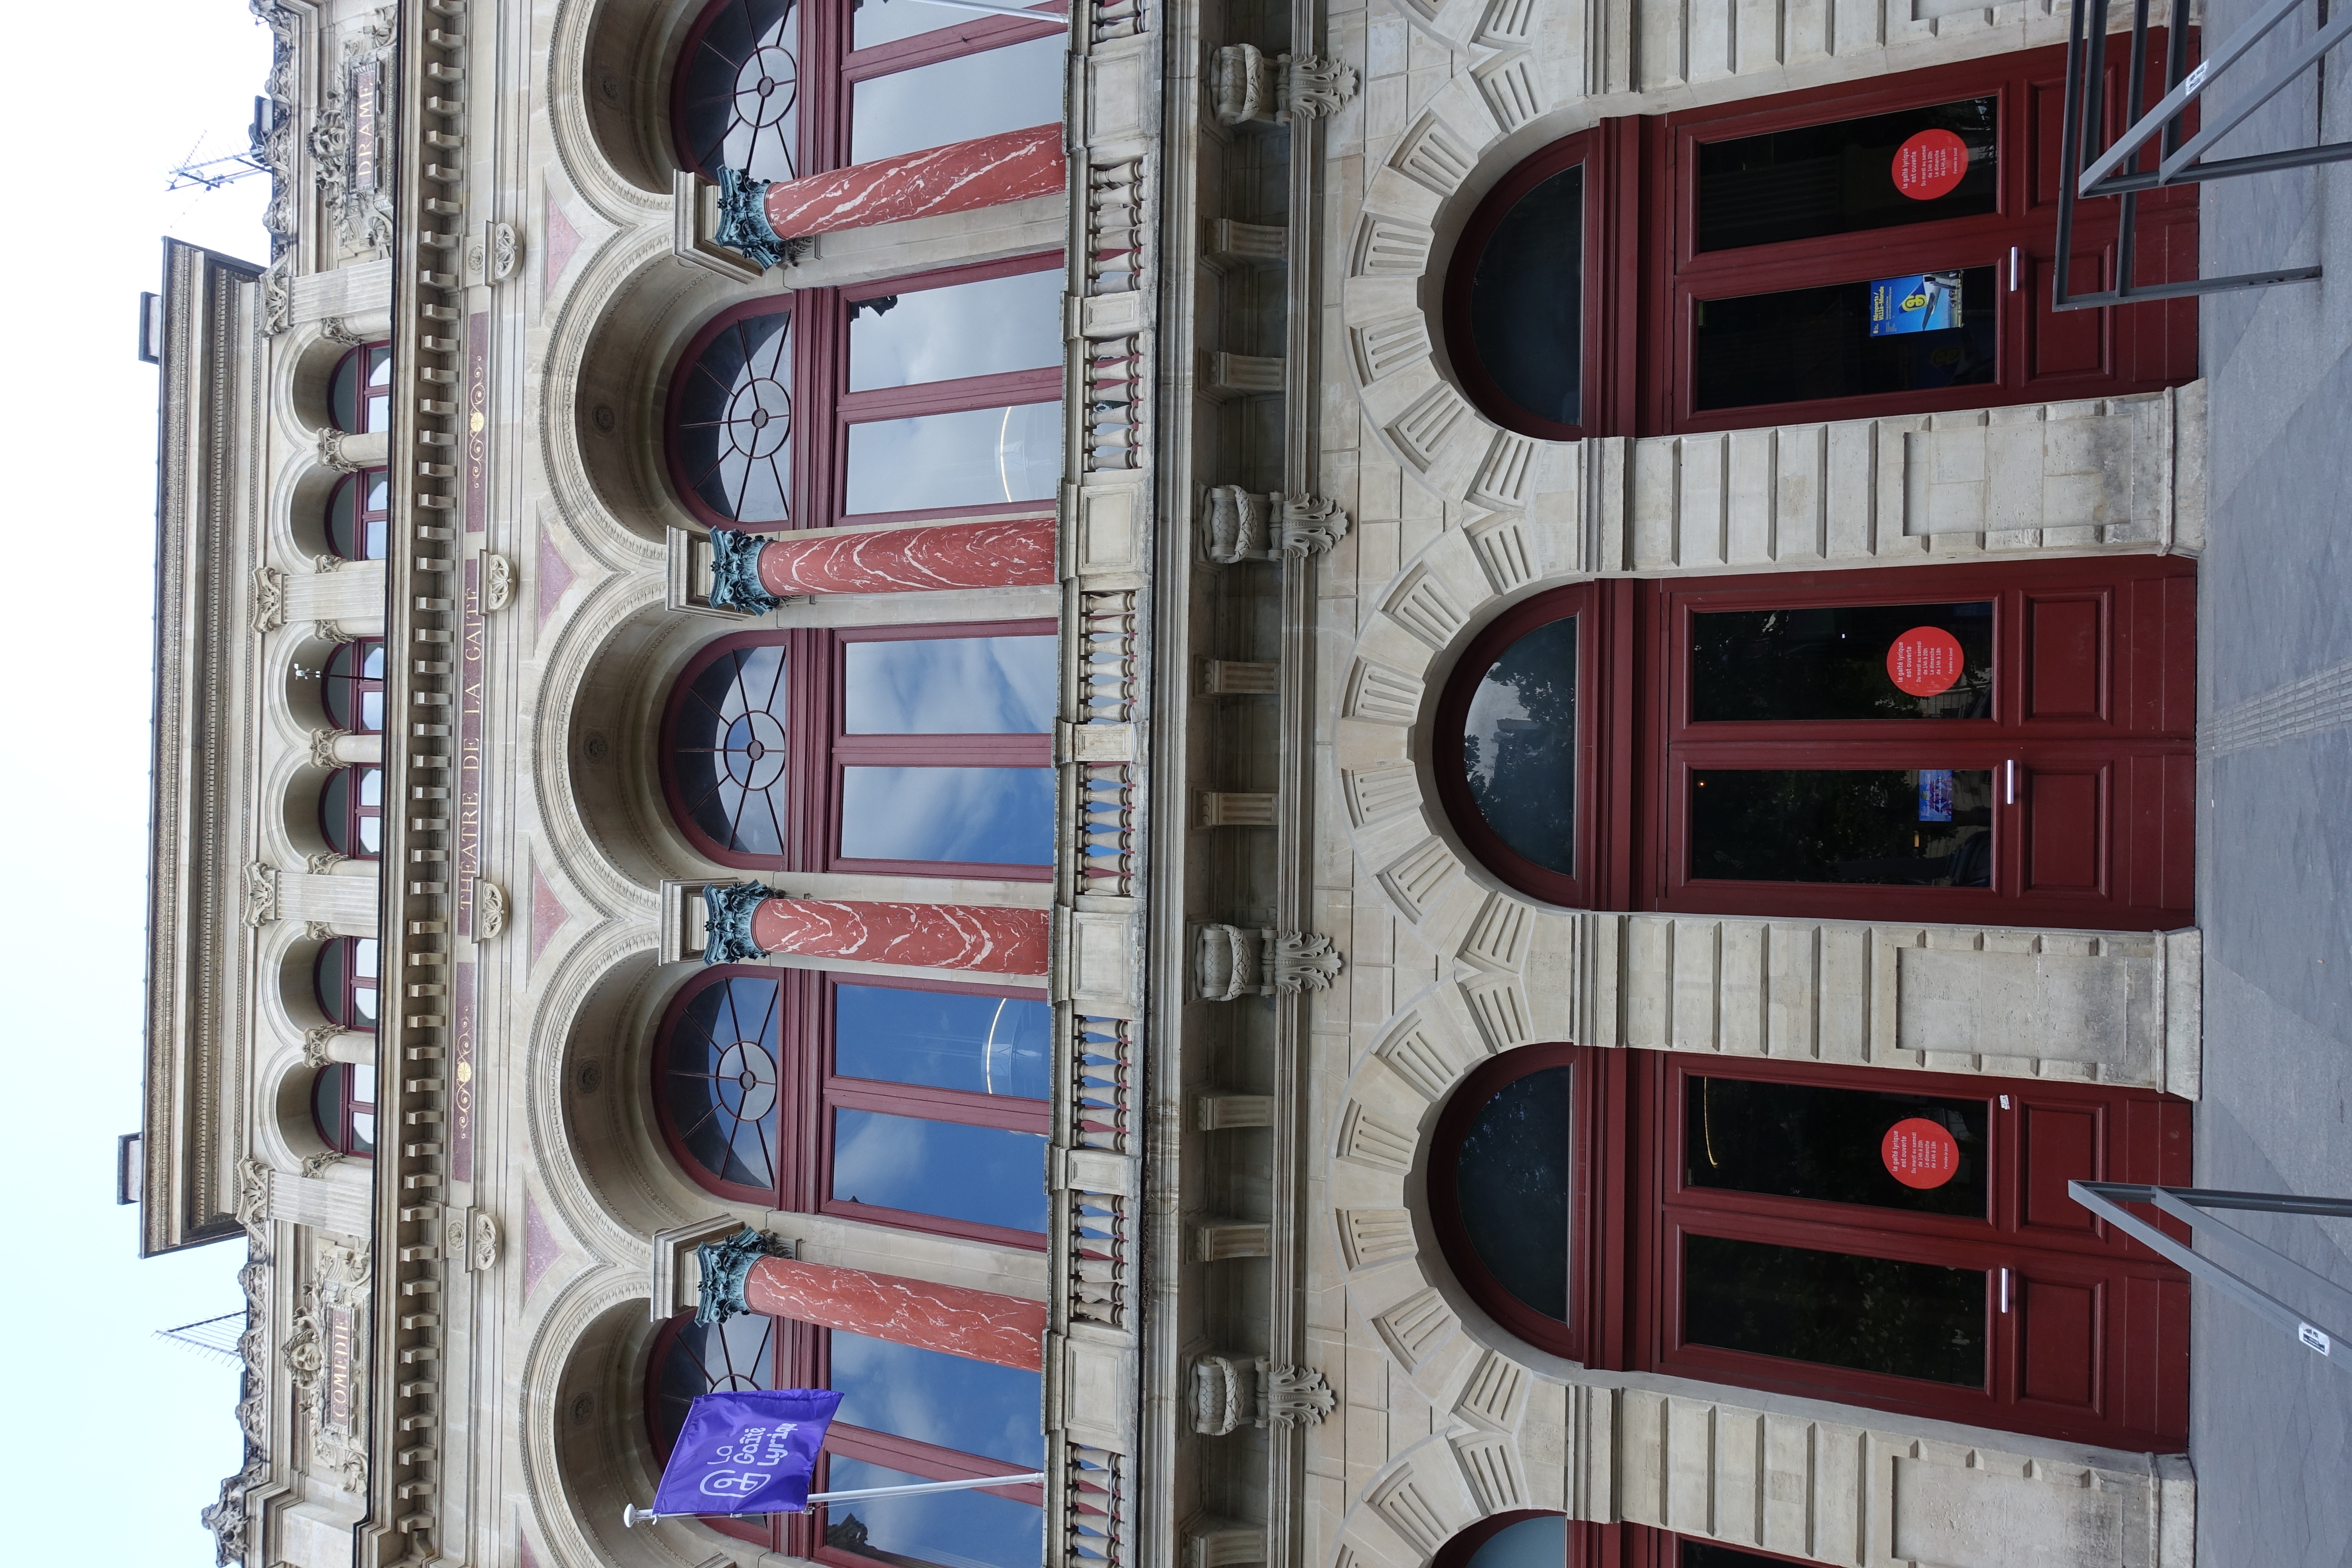

Design that asks for a longer view
The announcement frames the exhibition around long-term change and an optimistic reading of data. That is the organiser’s framing, not our independent assessment of the underlying datasets. This note is based on the published programme, not a visit.
Our studio take: keep the explanation attached
When a chart moves onto a poster, brochure or presentation handout, keep its title, units, date range and source with it. A striking shape should still tell the reader what is being compared.
Check whether the graphic shows a count, a percentage or a change between two values. Those meanings need different labels. If a comparison uses a selected period or geography, make that scope visible rather than leaving it in a separate document.
Read the proof without the presenter
Print the graphic at its intended size and ask someone to explain it without a spoken introduction. If they cannot identify the measure or the comparison, revise the caption and labels before polishing the decoration.
Check that distinctions survive the chosen paper and reproduction size. Use labels or patterns alongside colour where they help separate categories, and keep the source line readable. These are Chromatic’s print-design observations inspired by the exhibition announcement, not a review of its individual works.
Sources
La Gaîté Lyrique via City of Paris — Finally, Something Good. ↗
Venue-submitted municipal listing updated September 8, 2026; checked October 25, 2026. Exhibition dates and curatorial framing attributed; English summary, no attendance or dataset-validation claim.